

Norwegian real estate – transaction values are rising faster than the fjords
The average transaction value of real estate in Norway has just surpassed 4.5 million Norwegian kroner—that’s about 1.7 million zlotys for a typical property. Sounds like numbers from another planet? Yet this is everyday reality for our northern neighbors.
The Norwegian real estate market is a phenomenon that many Polish investors see as something exotic. But is that perception justified? While in Poland we’re still debating apartment prices hovering around several hundred thousand zlotys, seven-figure transactions have become the norm there.
The real issue isn’t the amounts themselves. What’s most intriguing is the pace of change—the transaction volume is growing by 5–7 percent annually, even though prices already seem astronomical. It’s a trend that should catch the eye of anyone considering real estate investments in Northern Europe.
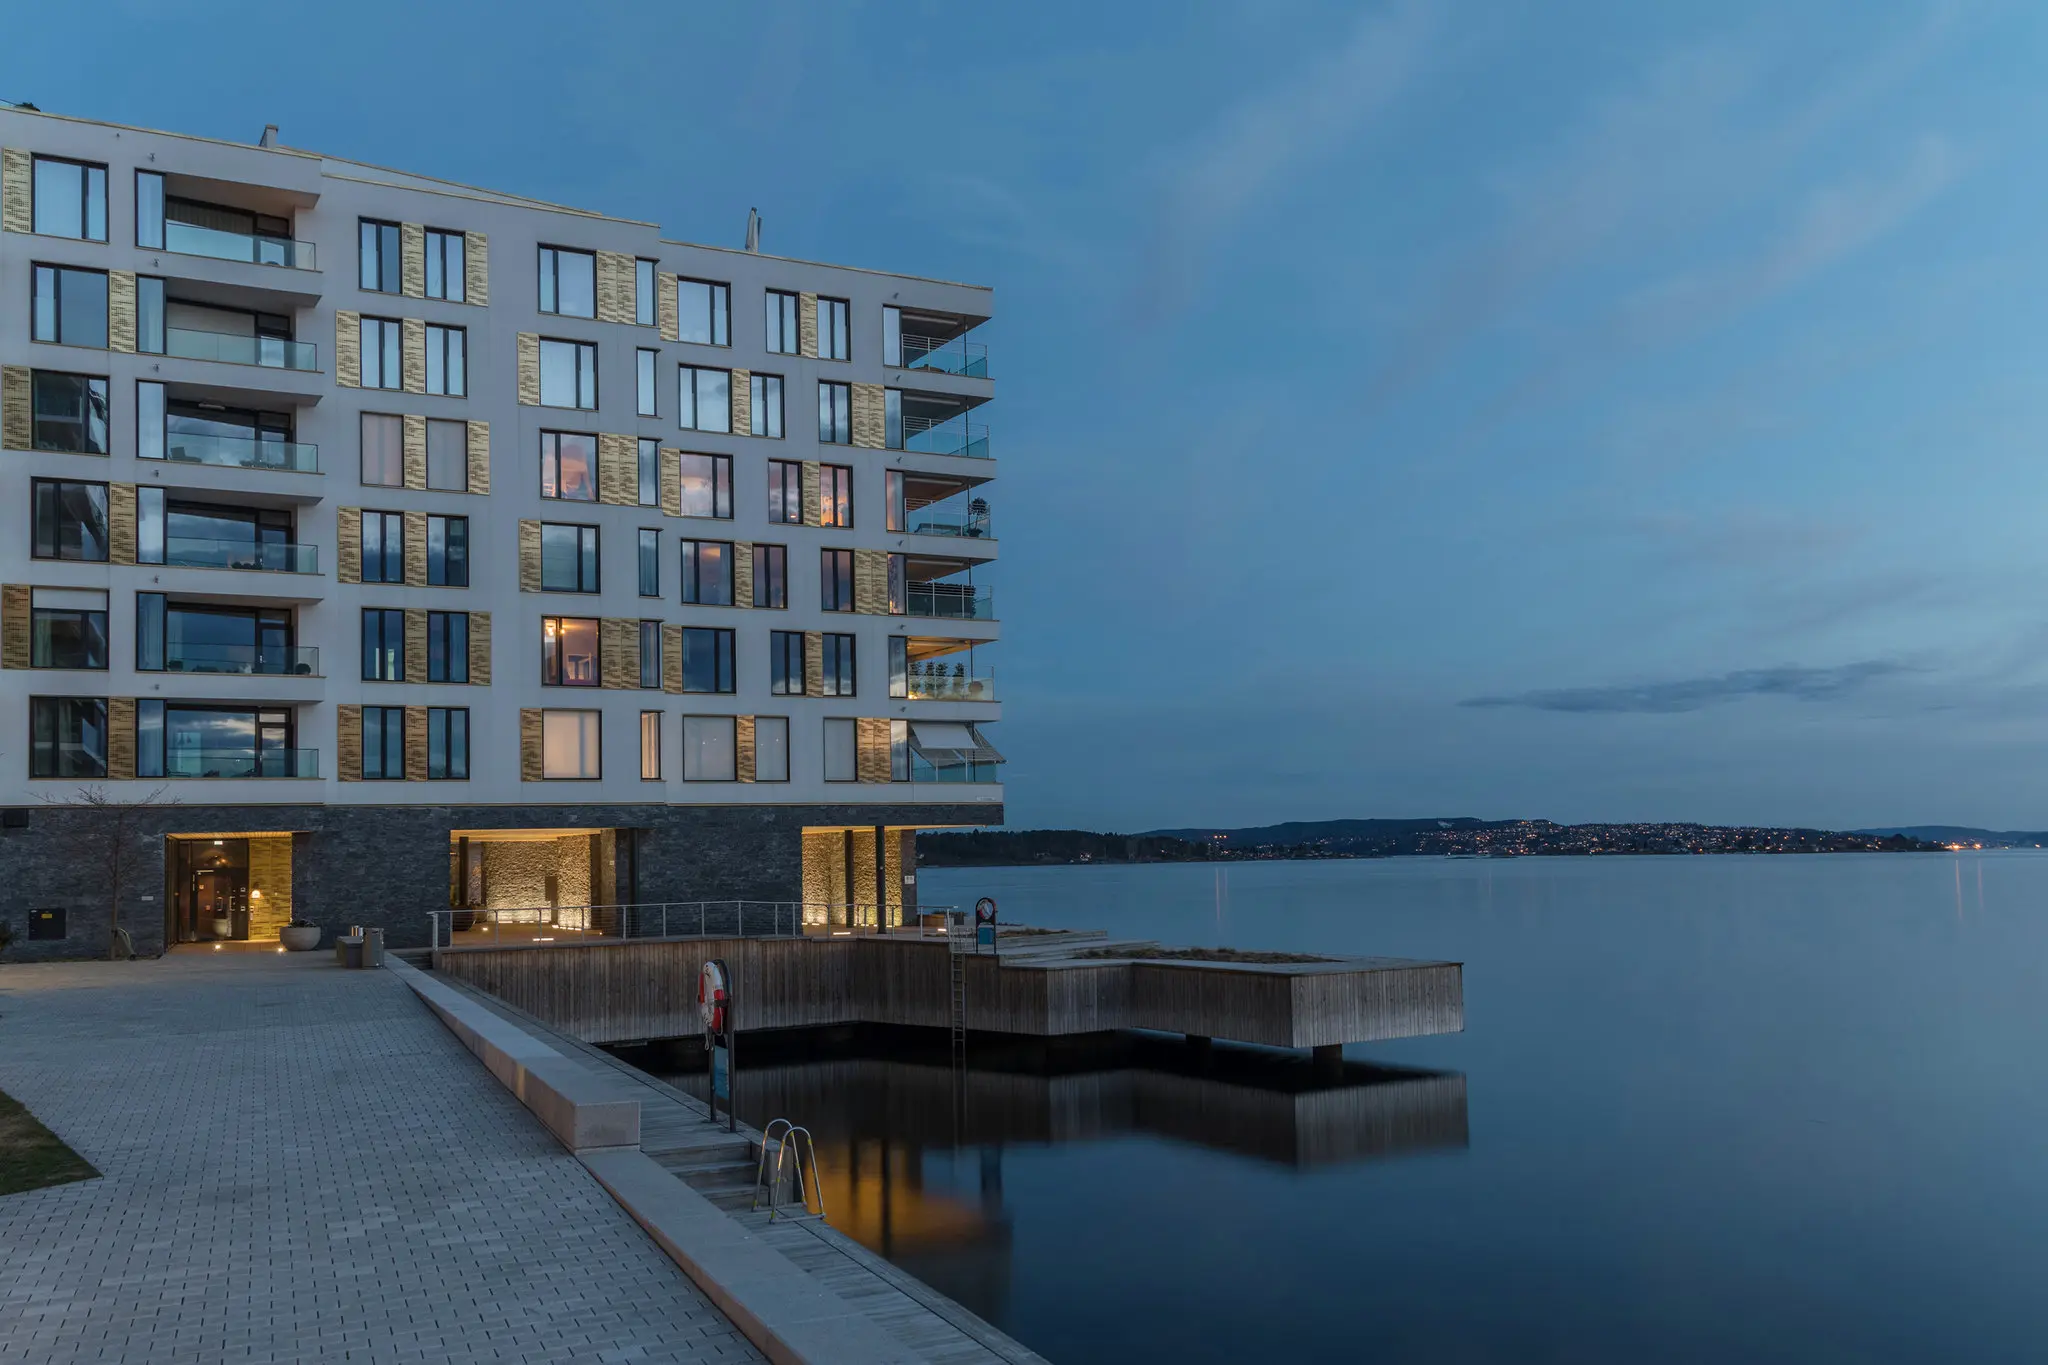
photo: nytimes.com
Norwegian real estate under the premium industry spotlight
Why is it worth taking a closer look at the Norwegian reality right now, at the end of 2025? Polish capital is increasingly venturing into foreign markets. Norway is no longer just a destination for earning money—it has become a place where Poles buy apartments, houses, and land. However, they don’t always understand the mechanisms of the local market.
The Norwegian model is a puzzle made up of many pieces. To put it together, you need to analyze four key areas. First—the historical evolution of value, which shows where today’s prices come from. Second—the contemporary drivers of growth, from regulations to demographics. Third—hard data and statistics that reveal the true scale of the phenomenon.
And finally, the fourth area—controversies and forecasts. Because the Norwegian market also raises concerns. Experts wonder whether these prices are justified or if we’re dealing with a speculative bubble.
Each of these aspects sheds light on a different part of the whole. Together, they create a picture of a market that fascinates some, frightens others, but leaves no one indifferent.
To understand where today’s numbers come from, let’s look back…
photo: europeanproperty.com
Historical evolution of real estate values 1950-2025
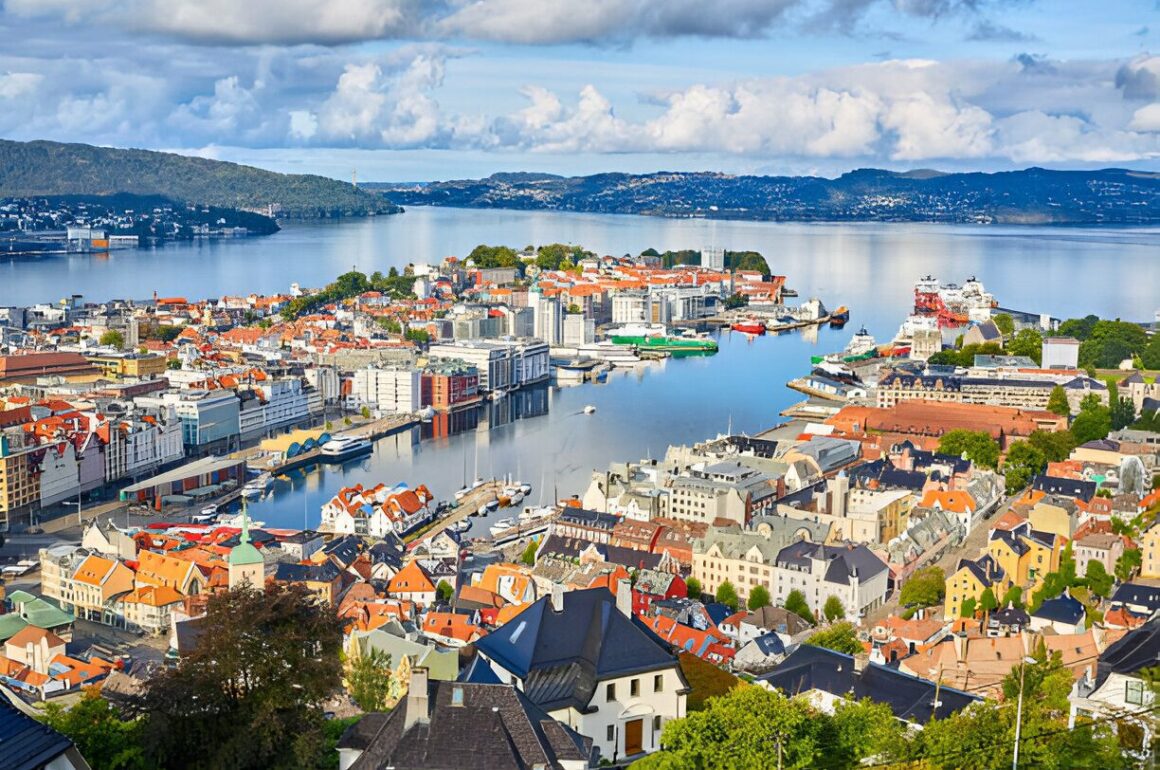
A house built in 1952 in Bergen cost around 45,000 Norwegian kroner at the time. The owner probably never imagined that the same property would be worth several million today. But that’s exactly how the Norwegian real estate market has evolved over the past seventy years.
The 1950s and 60s – Postwar Foundations
After the war, Norway rebuilt itself slowly. Most people lived in rural areas, cities were small. A typical house cost between 40,000 and 95,000 kroner. Price increases? Barely noticeable, maybe 2-3% per year. Loans were hard to get, regulations were everywhere. The agricultural society was just beginning to consider moving to the cities.
Everything changed in 1969. They found oil.
The 1970s and 80s – The “Oil Effect”
This is when the real frenzy began. Norwegians suddenly had money that had never existed before. Oil beneath the seabed meant jobs, high salaries, optimism. Property prices rose by 10-15% each year. A house that cost 100,000 kroner in the early 70s was already 300,000-400,000 by the early 80s.
But euphoria has its limits.
The 1987-1988 Crisis – A Painful Lesson
For years, banks handed out loans like candy. Everyone wanted to buy a house, everyone got a loan. The bubble burst spectacularly. Within two years, prices dropped by 20-30%. People lost their life savings, banks collapsed. “It was a shock for the whole society, no one expected it,” economists from that era later recalled.
The government learned its lesson. It introduced stricter banking regulations and credit controls. These rules are still in place today.
The 1990s – Liberalization and a Leap in Quality
After the crisis came openness. In 1994, Norway joined the European Economic Area. Suddenly, foreign investors could more easily buy Norwegian real estate. Banks started lending again, but more cautiously than before.
The leap was dramatic. The average house price in 1990 was about 500,000 kroner. By 2000 – already 2 million. Ten years, a fourfold increase. Oslo and Bergen led the way, but the growth affected the entire country.
2000-2010 – Stabilization at a High Level
The new century brought a calmer pace, but prices kept rising. Norwegians got used to expensive real estate. The government introduced more regulations, trying to slow the growth. The 2008 financial crisis hit Norway much more mildly than other countries.
2010-2020 – Market Maturity
The last decade has been a period of consolidation. Prices remained high, but the increases were no longer so spectacular. Young Norwegians complained they couldn’t afford their own homes. The government experimented with various housing solutions.
| Year/Decade | Key event | Impact on prices |
|---|---|---|
| 1950-1960 | Post-war reconstruction | Growth of 2-3% per year |
| 1969 | The discovery of oil | The beginning of a bull market |
| 1970-1985 | “The oil effect” | Growth of 10-15% per year |
| 1987-1988 | Banking crisis | Drop of 20-30% |
| 1994 | Entry into the EEA | Influx of foreign capital |
| 1990-2000 | Market liberalization | Growth from |

photo: hurghadiansproperty.com
Key drivers of current growth
Let’s consider a typical homebuyer at the start of 2025. They have a stable job, savings set aside for a down payment, but face a dilemma—should they buy now, or wait a little longer? Market mechanisms are working in their favor, though not all of them are immediately obvious.
Norges Bank reference rate: 4.5%
Impact on mortgages: direct and immediate
Four main forces are currently driving demand for Norwegian real estate:
- Monetary policy at 4.5% is paradoxically stabilizing the market – after a period of fluctuations, people now know what to expect, banks have adjusted their criteria, and creditworthiness has become predictable
- A green energy mix with 88-90% hydro translates into lower bills – while neighboring countries pay a fortune for electricity, Norwegians enjoy a real advantage in living costs
- New shelter construction requirement from January 2025 – applies to buildings over 1,000 m² and increases investment costs by 5-10%, which limits the supply of new projects
- The bostøtte program effectively supports young buyers – housing subsidies aren’t just theory; they mean real money in the pockets of first-time buyers
It’s fascinating how these seemingly distant factors intertwine. Normally, high interest rates should cool the market, but here, different mechanisms are at play. Low maintenance costs for properties offset more expensive loans. New building regulations limit competition from developers. And government support simply adds more fuel to demand.
The synergy effect is simple – demand remains strong despite seemingly unfavorable lending conditions. Buyers calculate the total cost of ownership, not just the loan installment. Sellers know that new supply will be more expensive to produce.
Let’s now see how these factors translate into specific numbers across different regions.

photo: acemoneytransfer.com
Data analysis: prices, volume, regions
“500-600 billion NOK” – that’s the total value of transactions on the Norwegian real estate market in 2024. This figure speaks for itself.
To truly understand the state of this market, you need to look at the hard data. Here’s a breakdown of price per square meter in Norway’s key cities as of November 21, 2025:
| City | Price per m² (NOK) | Y/Y change (%) |
|---|---|---|
| Oslo | 80,000 | +12.3 |
| Bergen | 65,000 | +8.7 |
| Stavanger | 58,000 | +6.2 |
| Trondheim | 52,000 | +9.1 |
| Tromsø | 40,000 | +4.5 |
Oslo leads with a record amount, while Tromsø remains the most affordable among the cities analyzed. The difference is exactly 40,000 NOK per square meter.
Transaction volumes also reveal interesting patterns. The residential segment saw a 3.2% decrease compared to the previous year. But one segment clearly stands out.
| Segment | Volume (pcs.) | Y/Y change (%) | Average price | Sales time (days) |
|---|---|---|---|---|
| Apartments | 95,400 | -3.2 | 4.8 million NOK | 28 |
| Single-family houses | 42,300 | +1.8 | 6.2 million NOK | 35 |
| Hytter | 18,700 | +9.0 | 2.3 million NOK | 45 |
Hytter, or Norwegian holiday cabins, saw a 9% increase in volume. The average price ranges from 2 to 3 million NOK, with a selling time of 45 days. That’s nearly twice as long as for regular apartments.
Foreign capital accounts for a relatively small share of the market. The share of buyers from outside Norway fluctuates between 5 and 10 percent of the total transaction value. Germans lead with a 2.8% share, followed by Swedes at 1.9% and Danes at 1.3%. Other countries make up a marginal portion.
The correlation between price and volume isn’t straightforward. In Oslo, where prices are highest, the number of transactions dropped by 1.8%. Meanwhile, in Tromsø, the cheapest city on the list, volume rose by 4.5%. It seems buyers are seeking alternatives to expensive city centers.
The average selling time nationwide is now 32 days—5 days longer than a year ago. Apartments in Oslo sell the fastest—21 days. The slowest are houses in northern regions—up to 60 days.
It’s worth noting that the premium segment (properties above 10 million NOK) accounts for only 2.1% of all transactions, but as much as 8.3% of the market’s total value. These proportions highlight how concentrated the Norwegian luxury real estate market is.
Data from the three largest cities—Oslo, Bergen, and Stavanger—represent 43% of the total transaction volume, but already 52% of the value. This confirms that the most expensive properties are concentrated in the main urban centers.
Behind these numbers lie heated debates that divide Norwegian society.

photo: expatfocus.com
Controversies: taxes, foreign ownership, and accessibility
The Norwegian real estate debate is heating up on three fronts. Taxes, foreign investors, and housing availability—each of these issues is dividing society.
The wealth tax for 2025 is sparking the most controversy. Supporters argue that the wealthy should pay more for their luxury properties. Opponents warn of capital flight—estimates suggest that 5-10% of affluent Norwegians may leave. These aren’t just numbers on paper. Many are already relocating to Switzerland or Denmark.
| Argument | Supporters | Opponents |
|---|---|---|
| Wealth tax | Social justice, more funds for public purposes | Capital outflow, job losses |
| Foreign ownership | Control over strategic assets | Restriction of the free market |
| Housing availability | The right to housing for all | Interference in market mechanisms |
Foreign ownership is the second flashpoint. Investment funds are involved in 5-10% of transactions. Sounds harmless? Critics disagree. They fear that international corporations are “buying up” the best locations.
“Our fjords are not for sale” – this is one of the popular tweets circulating on Norwegian social media.
“Capital has no nationality. What matters are investments and jobs,” respond advocates of the open market.
Housing affordability hits ordinary people the hardest. Eurostat data reveals harsh numbers—over 40% of household income goes toward housing. This means that every other krone earned by the average family ends up in the hands of property owners.
Young Norwegians are waiting longer and longer to buy their own homes. The older generation doesn’t understand the problem—they bought houses for next to nothing. The intergenerational conflict is growing.
Environmentalists add their own arguments. They criticize the development of the fjords from an environmental protection perspective. Every new waterfront project sparks protests. Developers respond that people have the right to live where they want.
All these disputes highlight deep divisions within Norwegian society. The rich versus the poor, the young versus the old, environmentalists versus developers. Each side has its own reasons and arguments.
How will these tensions shape the future of Norway’s real estate market in the coming years?
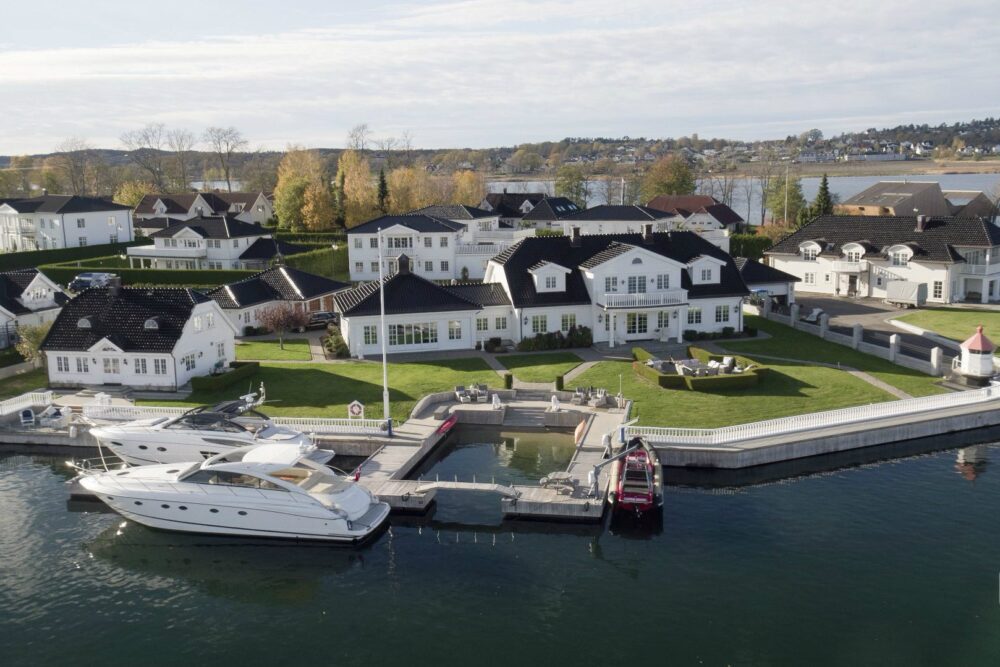
photo: jamesedition.com
2026-2030 forecasts and market scenarios
Artificial intelligence in real estate valuation may sound like science fiction, but Norwegian companies are already testing these solutions. This could be the key to a breakthrough between 2026 and 2030.
I have prepared three scenarios for the development of the Norwegian real estate market. Each is based on different macroeconomic and technological assumptions.
| Scenario | CAGR | Key assumptions | Key risks |
|---|---|---|---|
| Basic | 3.0–5.0% | 100,000 institutional rental units by 2030, stable interest rates | Energy inflation, NOK exchange rate fluctuations |
| Optimistic | 6.0–7.0% | Boom in green buildings, AI in valuations, influx of ESG capital | Overregulation, tech bubble |
| Pessimistic | 0.0-2.0% | Rapid phase-out of oil starting in 2027, structural recession | Capital exodus, banking crisis |
The baseline scenario assumes a continuation of current trends. Norway is gradually diversifying its economy, but without any dramatic shifts. Institutional renting is growing organically—developers build, funds buy. Nothing revolutionary, but steady.
The optimistic scenario is every green investor’s dream. Here, Norway becomes Europe’s leader in sustainable real estate. AI algorithms value properties in real time, and ESG-funds compete for every project. It sounds wonderful, but is it realistic?
The pessimistic scenario… well, it’s not a pleasant read. If Norway moves away from oil too quickly without a proper alternative, things could end badly. The real estate market would take a hit from broader economic troubles.
The sensitivity matrix highlights three main variables: interest rates (impacting financing), tax policy (especially property taxes), and energy prices. That last point is crucial—Norway is a petroparadise, but for how much longer?
For the baseline scenario to play out, a smooth energy transition without economic shocks is essential. The optimistic scenario requires an influx of foreign capital and a technological breakthrough. The pessimistic one? Just a single major global recession would suffice.
Of course, these forecasts are just models. Reality will likely be a mix of all three scenarios, with a few surprises no one saw coming.
photo: thenorwayguide.com
Turn data into strategy – what’s next for investors and decision-makers
Remember the question from the beginning – how do you turn data into real profits? Now you have the answer. It’s time to move from analysis to concrete action.
Don’t wait for the perfect moment. Markets don’t give second chances to those who hesitate too long. You can start any of these steps this week.
And if you have questions or want to discuss specific scenarios – you know where to find me. Sometimes the best strategies are born in conversation, not in solitary planning.
Max
real estate editorial team
Luxury Blog


Leave a Comment